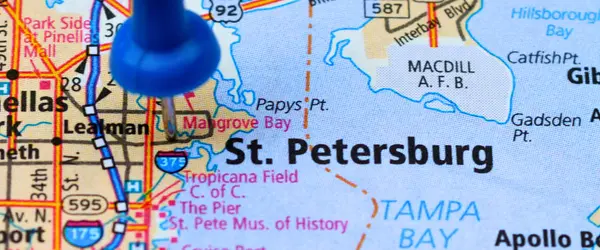
Tampa Bay Real Estate Market Report: March 2026
Prepared by Kirby Drake, Real Estate Advisor | Engel & Völkers South Tampa | March 2026
The Tampa Bay real estate market is recalibrating. Transaction volume is down from this time last year, sellers are cutting prices more often than raising them, and buyers in certain segments have more leverage than they have had in years. But the market is still moving. Over 4,100 single-family homes closed across the region in the past four weeks alone.
This report covers the four-week period ending March 29, 2026, using the latest MLS data from the Suncoast Tampa Association of Realtors. I break down what is happening across Tampa Bay as a whole, with a specific focus on what the numbers mean for homeowners and buyers in Pinellas County and St. Petersburg, Florida.
If you are weighing a decision to buy or sell in this market, the data below should give you a clear, grounded picture of where things actually stand.
Tampa Bay Single-Family Home Market
At the regional level, the single-family home market is producing fewer transactions than a year ago, but active inventory is tightening as the reporting period progresses, a dynamic that matters for anyone planning to list or buy this spring in the Tampa Bay area.
The clearest pattern in the single-family data is the steady compression of new active listings each week, from 1,911 in week one down to 1,332 by week four. The spring market is not arriving flooded with inventory. That tightening creates a more workable environment for a well-positioned seller than the raw year-over-year transaction comparisons might suggest.
On the pricing side, 119 price decreases were recorded in the most recent daily market change data versus only 4 price increases across Tampa Bay. Sellers anchored to 2022 or 2023 values are being forced to correct, typically after accumulating days on market that weaken their position further.
What This Means for Sellers
The market rewards precision. Homes that are well-priced from day one continue to generate activity. Homes that start too high sit, reduce, and frequently sell for less than an accurate opening price would have produced. If you are considering listing in St. Petersburg or Greater Tampa Bay, your pricing strategy needs to be grounded in current, local data, not national headlines.
What This Means for Buyers
You have more negotiating room than you did two years ago. Price reductions are happening across the region and sellers are more motivated to engage with serious, prepared buyers. That said, well-maintained homes in established neighborhoods at accurate prices are not sitting. The inventory compression is clear: quality moves. Overpriced or deferred-maintenance properties do not.
Tampa Bay Condo Market
The condo segment tells a more nuanced story. Transaction counts are modestly up year over year, but dollar volume has increased substantially a signal that activity is concentrated at higher price points rather than distributed across the market evenly.
The 35% jump in condo dollar volume year over year is notable, but it is best read alongside the daily market change data: 43 price decreases and zero price increases in the same period. The volume increase is concentrated in the upper tier of the market. A meaningful number of condos are under pricing pressure at the same time.
Important context for condo owners in Tampa Bay: Florida's milestone inspection and reserve funding requirements continue to create uneven conditions across the condo market. Buildings that have addressed structural assessments and reserve studies are transacting. Buildings that have not or that carry unresolved special assessment risk are facing suppressed values and limited buyer pools even in otherwise strong neighborhoods. If you own a condo or are considering buying one in the Tampa Bay area, understanding the building's compliance status is not a secondary concern. It is the single most important due diligence item in this market right now.
Pinellas County: A Closer Look
Pinellas County is my primary market, and the data here reflects an area working through price discovery one that still has real, underlying demand but requires disciplined positioning from both buyers and sellers.
Single-Family Homes Pinellas County
The 18% decline in weekly closing count versus last year is meaningful, but the volume decline of only 5% (from $149M to $142M) tells a different story about pricing. Homes that are selling in Pinellas County are still selling at strong values. The issue is fewer transactions, not a collapse in what well-positioned homes are worth.
Of all five counties in this report, Pinellas had the smallest year-over-year volume decline. That distinction reflects continued demand for well-located properties in St. Petersburg and across the Pinellas peninsula, even as the broader Tampa Bay market softens.
The daily market change data for Pinellas County is direct: 27 price decreases versus 1 price increase in the most recent snapshot. For every home that raised its price, 27 others came down. That ratio defines the negotiating environment for buyers in this market right now.
Condos Pinellas County
Pinellas condo closings came in at 98 for the week of March 23-27, compared to 85 the same week last year, a 15% increase in transaction count. More significantly, weekly volume reached $50.5 million versus $28.3 million, a 78% increase in dollar volume on a modest increase in transactions. This is the clearest signal in the report that higher-priced condos in Pinellas County are actively transacting.
That said, 18 price decreases and zero price increases in the Pinellas condo segment this same week indicate the volume growth is not uniform. The upper tier is moving. Lower and mid-range condos continue to face headwinds from rising insurance costs, HOA fee increases, and financing friction tied to building compliance status under Florida's structural safety requirements.
County-by-County Snapshot
Single-family home performance across the five counties tracked in this report for the four-week period ending March 29, 2026. Weekly volume comparisons use the equivalent period from March 2025.
| County | 4-Wk Closings | Wk Volume 2026 | Wk Volume 2025 | YoY Volume |
|---|---|---|---|---|
| Pinellas | 817 | $142.1M | $149.4M | -5% |
| Hillsborough | 1,149 | $136.6M | $199.1M | -31% |
| Pasco | 802 | $82.3M | $104.2M | -21% |
| Sarasota | 710 | $122.3M | $168.9M | -28% |
| Manatee | 653 | $110.4M | $148.0M | -25% |
Pinellas is outperforming the rest of the Tampa Bay region on a year-over-year basis by a meaningful margin. A 5% volume decline versus declines of 21% to 31% across the other four counties reflects the enduring demand for properties in St. Petersburg and along the Pinellas peninsula.
Hillsborough County's 31% volume decline is the sharpest in the region. This likely reflects a combination of elevated new construction inventory in the eastern corridor and continued buyer hesitation at higher price points in the South Tampa segment, compounded by rising insurance and carrying costs that are affecting transaction velocity across that market.
My Read on the Market
The data points in one direction: this is a market where preparation and positioning matter more than timing. Sellers who understand where prices actually are right now, not where they were, are still closing well. Buyers who are pre-approved and specific about what they want are finding opportunities that did not exist 18 months ago.
In Pinellas County and St. Petersburg specifically, I continue to see real demand for well-maintained single-family homes in established neighborhoods. The compression of new active listings each week tells me the spring market is not oversupplied, which is a reasonable environment for a well-positioned seller. But the 27-to-1 ratio of price cuts to price increases makes one thing clear: the window for wishful pricing is closed.
If you are thinking about buying or selling in the St. Petersburg or Greater Tampa Bay market, I am happy to walk through what this data means for your specific situation not in general terms, but with address-level precision.
Common Questions
Is the Tampa Bay real estate market slowing down in 2026?
Transaction volume across Tampa Bay is down roughly 22% compared to the same period in March 2025 for single-family homes. However, the market is not stalled 4,131 single-family homes closed across the region in the past four weeks. The slowdown reflects buyers exercising more caution and sellers adjusting prices to current conditions, not a collapse in demand. Active inventory is also declining week over week, which limits how much additional softening is likely near term.
How is the Pinellas County housing market performing in March 2026?
Pinellas County recorded 197 single-family home closings in the week of March 23–27, 2026, compared to 240 in the same period last year a decline of about 18% in transaction count. Total weekly volume was $142 million versus $149 million the prior year. Of the five counties tracked in this report, Pinellas had the smallest year-over-year volume decline at roughly 5%. Price reductions outnumber price increases 27 to 1 in the most recent data, indicating buyers have meaningful negotiating leverage in many segments of the St. Petersburg market.
Are condo values in Tampa Bay holding up in 2026?
It depends on the building. Condo dollar volume across Tampa Bay reached $108.5 million for the week of March 23–27, 2026, compared to $80.2 million during the same period in 2025 a 35% year-over-year increase. This suggests pricing has moved higher in the portion of the market that is actively transacting. However, condos in buildings with unresolved inspection requirements, pending special assessments, or reserve funding deficiencies face real headwinds. A building-level review is essential before buying or listing a condo in Florida's current regulatory environment.
Is it a good time to sell a home in St. Petersburg, Florida in 2026?
For well-located, well-maintained homes priced on current data, yes. Active inventory in Pinellas County is declining each week from 386 new listings in week one of the reporting period down to 227 by week four which reduces direct competition for a well-positioned listing. The key risk is overpricing. With 27 price decreases recorded against just 1 price increase in the most recent market change data, homes that start too high sit, reduce, and often sell for less than a properly priced original list would have produced. Pricing discipline from day one is the most consequential decision a seller makes in this environment.
How does the St. Petersburg real estate market compare to the rest of Tampa Bay in 2026?
Pinellas County (which includes St. Petersburg) is outperforming the broader Tampa Bay region on a year-over-year basis. Pinellas recorded only a 5% year-over-year decline in weekly dollar volume for the week of March 23–27, 2026, compared to declines of 21% to 31% across Hillsborough, Pasco, Sarasota, and Manatee counties. That distinction reflects continued demand for well-located residential properties in St. Petersburg and throughout the Pinellas peninsula.
Data sourced from the Suncoast Tampa Association of Realtors 4-Week Market Report, period ending March 29, 2026, published March 30, 2026. All figures represent MLS-reported activity. Market conditions vary by neighborhood, price point, and property type. This report is for informational purposes and does not constitute a comparative market analysis or opinion of value for any specific property. Year-over-year comparisons use the closest equivalent reporting period from 2025. Some weekly figures may reflect partial reporting periods.
Questions about what this data means for your home or your next move?
Kirby Drake · Engel & Völkers South Tampa · kirbydrakerealtor.com
Categories
- All Blogs (44)
- 2025 Tampa Real Estate Market (14)
- 2026 Market Trends (8)
- Buyer (5)
- Buyer Resources (1)
- Buying & Selling Strategies (1)
- Buying Tips (7)
- Education (4)
- Flood Insurance (2)
- Florida Condo Market (1)
- Florida Home Buyer (1)
- Florida Home Insurance (2)
- Home Buyer (8)
- Home Seller (12)
- Homeownership & Planning (1)
- Hurricane Relief Resources (2)
- Investments & Rentals (1)
- Investor Tips (2)
- Local Lifestyle & Community (1)
- Luxury Real Estate (1)
- Luxury Real Estate Insights (1)
- Market Insights (1)
- Market Reports (2)
- Market Updates (1)
- NAR Updates (1)
- Neighborhood Spotlight (5)
- New Construction (1)
- Pinellas County Real Estate Market (1)
- Property Investor (1)
- Real Estate Investment (1)
- Seller Resources (3)
- Selling Tips (9)
- South Tampa Real Estate (1)
- St. Petersburg Real Estate (3)
- St. Petersburg Real Estate Market (7)
- St. Petersburg, FL (6)
- Tampa Bay Luxury Real Estate Market (1)
- Tampa Bay Real Estate (1)
- Tampa Bay Rental Market (1)
- Tampa Home Buying (7)
- Tampa Real Estate (5)
- Tampa Real Estate Market (10)
Recent Posts